Blog Post
Debut Q1’26 ESG Primary Insights Wrap
Octus’ Data Shows ESG Dispersion Widens on Measurable Execution; Governance Gaps Emerge for Sponsor-Backed Issuers
Welcome to the first edition of Octus’ ESG Quarterly Insights, focused on ESG developments in the leveraged loan and high-yield bond markets across Q1’26. Drawing on primary issuer analysis, the report combines an ESG overview with sector-level insights and a breakdown of issuance activity across the EU and U.S., highlighting trends in issuance dynamics, regional divergence and structural factors shaping current conditions.
The analysis is based on the Q1 primary dataset (selected coverage) and does not represent, and should not be interpreted as representative of, broader market-wide trends across all Q1 2026 issuance.
Key Takeaways
- ESG outperformance is increasingly defined by measurable execution rather than disclosure alone. Leading issuers distinguish themselves through demonstrated decarbonization progress, stronger human capital indicators and more formalized governance structures, with performance differentiation increasingly visible across all three pillars.
- Environmental risk is driven by Scope 3 dominance rather than operational control. Value-chain emissions account for up to 99% of total footprints, limiting comparability and shifting focus toward supplier and downstream dependencies.
- Social performance is increasingly polarized across sectors. Higher female participation in healthcare and service-oriented industries contrasts with persistently constrained representation in STEM-intensive sectors, where workforce composition is limited by technical talent pipelines.
- Governance gaps are concentrated in sponsor-backed issuers. Limited board independence, lower gender diversity and uneven disclosure reflect a persistent structural “private equity effect.”
This report assesses ESG performance across 73 primary leveraged loan and high yield bond issuers in Q1 2026, based exclusively on a selected subset of transactions covered by Octus during the period and not the full universe of new issuance. The analysis draws on issuer disclosures to assess environmental, social and governance outcomes in the context of evolving issuance trends. The dataset highlights widening dispersion across issuers, reflecting differences in business models and ownership structures, alongside variation in regional reporting practices. These factors shape emissions profiles, workforce composition and governance frameworks, with important implications for comparability and transparency across the market.
Selected ESG Performers: Measurable Decarbonization, Social Indicators and Governance Developments
Environmental Decoupling and Decarbonization Trends
Several primary issuers across Europe and the United States in the first quarter, in our dataset, demonstrated measurable separation between revenue growth and environmental impact, primarily through emissions intensity reductions and energy transition initiatives.
- Gerflor, the French flooring company, reported a 58% reduction in Scope 1 and 2 emissions intensity since 2019, exceeding its initial trajectory. Water efficiency improvements were also material, with a 62% decline in water intensity driven by closed-loop cooling systems at key production sites.
- Flora Food, a Dutch plant-based food producer, recorded a 36% absolute reduction in total emissions versus its 2020 baseline, aligned with its SBTi-validated 2050 net-zero pathway.
- Advanced Drainage Systems, the U.S.-based water pipes manufacturer, achieved a 28% reduction in emissions intensity following a 2022 baseline reset, reflecting progress against its Science Based Targets framework.
- Janus Henderson, a U.K.-based global asset manager, reduced operational Scope 1 and 2 emissions intensity by more than 50% compared with 2019 levels, indicating decoupling of direct emissions from revenue growth in a low-emissions operational profile.
- U.K.-based life sciences services LGC Group increased renewable electricity sourcing to 64% from 32% in 2022, while reducing combined Scope 1 and 2 emissions by approximately 22% versus its 2021 baseline.
Circular Economy and Waste Management Outcomes
Circularity outcomes vary by sector, with manufacturing and materials companies reporting the highest waste diversion performance.
- Flora Food achieved a 97% waste diversion rate across 15 manufacturing sites, effectively operating at zero waste to landfill.
- Tarkett, the flooring materials producer, reported a 78.5% waste diversion rate and an increased share of recycled raw materials at 19.4%.
- ZF Friedrichshafen AG, an automotive technology supplier, diverted 92% of total waste from disposal, with an 88% recycling rate across its automotive manufacturing operations.
Social and Governance Indicators
Human capital and governance metrics show divergence across specialized industrial and technology-driven sectors.
- Element Materials Technology, which provides testing certification services, reported a Total Recordable Incident Rate of 0.65 (per 200,000 working hours), compared with the Octus industry average of 1.50 in the sector.
- Sirius XM Radio, a satellite radio and audio platform, and Eutelsat Communications, a satellite communications operator, report higher board diversity relative to Octus industry averages. Eutelsat has 67% independent board members and 42% female representation, while Sirius XM reports 44% female board representation.
- HomeToGo SE, which operates a vacation rental platform, reports a workforce composition of 51% female employees, alongside a voluntary turnover rate of 25.6%, compared with the industry average of 38%, indicating comparatively lower attrition within its peer set.
Where referenced, industry averages reflect benchmark values calculated across the Octus universe for companies within the same GICS industry, based on 2024 reported data. These averages are derived from available issuer disclosures and are intended to provide consistent points of comparison across sectors, rather than serve as rating or performance thresholds.
Scope 3 Dominance Shifts Environmental Risk Toward Value Chains
Environmental risk across our ESG Q1 issuer data universe is primarily driven by Scope 3 emissions, which account for the majority of total emissions across most sectors and, among disclosing issuers, typically range from 75% to over 99% of total footprints.
In 18 cases, Scope 3 exceeds 90% of emissions, with 6 issuers approaching near-total value-chain exposure, particularly in distribution, retail and industrial models where emissions are embedded in supplier networks and downstream product use rather than direct operations.
This shifts environmental risk assessment toward value-chain dependencies, as illustrated by issuers such as Ahlsell, EG Group and Rubix, where emissions are concentrated almost entirely outside operational boundaries. Scope 3 disclosure becomes central to assessing environmental risk, with significant variation across sectors as shown in the chart below.
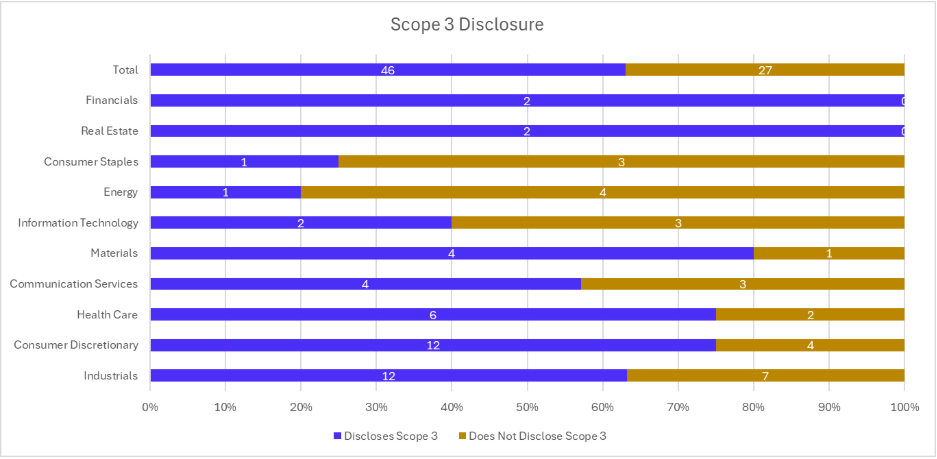 Source: Octus Data
Of the issuers analyzed, 63% disclose Scope 3 emissions, while 37% do not provide value-chain data, leaving over one-third of the dataset without visibility on full emissions exposure. Within the non-disclosing group, 17 issuers (23.3% of total) report only Scope 1 and 2 emissions, reinforcing a structural gap between the materiality of Scope 3 and its measurement in reported disclosures.
Variation across sectors reinforces this dispersion. Disclosure is weakest in Energy (20%), Consumer Staples (25%) and Information Technology (40%), despite business models in these sectors often implying material upstream and downstream emissions exposure. By contrast, Materials (80%), Healthcare (75%) and Consumer Discretionary (75%) show higher adoption rates, although coverage is not always consistent and frequently reflects early-stage or partial reporting rather than mature value-chain accounting. Industrials, despite being the largest sector in the sample, report Scope 3 in 63.2% of cases, indicating moderate but incomplete coverage in the most emissions-relevant segment of the dataset.
Regional differences remain pronounced. EU-based issuers account for the majority of Scope 3 disclosures (approximately two-thirds of reporting companies), while U.S. issuers show materially lower adoption. This reflects a higher degree of reporting standardization and regulatory influence in Europe, compared with a more heterogeneous disclosure environment in the U.S.
Transition alignment follows a similar structure. About 14 issuers (19.2%) have SBTi-validated targets, while a further 9 (12.3%) are in progress. Adoption is concentrated in Europe, with issuers such as Tarkett, Gerflor, Flora Food Group and VDK Groep operating under validated Scope 3 pathways or supplier-engagement frameworks. By contrast, validated adoption among U.S. issuers remains limited, with Advanced Drainage Systems representing a key exception, leaving the majority of the dataset without formal SBTi-aligned Scope 3 targets.
These gaps are compounded by broader disclosure fragmentation. Only 63% of issuers provide full emissions reporting across Scope 1, 2 and 3, while the remainder are split between partial disclosure and no disclosure. Issuers such as CeramTec, Inspired Education and Light & Wonder omit Scope 3 entirely, while others, including Maxam, provide incomplete or evolving datasets, constraining cross-issuer comparability.
Operational decarbonization remains visible but secondary in explanatory power. Issuers such as Advanced Drainage Systems, SGB-SMIT and Tarkett report reductions in Scope 1 and 2 intensity but these improvements have limited effect on overall emissions profiles in the absence of comprehensive value-chain coverage or aligned Scope 3 reduction frameworks.
STEM Talent Constraints Shape Diversity Outcomes
Diversity outcomes emerge as the most pronounced and consistently observable dimension of social performance across our ESG Q1 dataset. Diversity outcomes remain constrained by structural limitations in science, technology, engineering and math, or STEM, talent pipelines, which act as a primary bottleneck across industrial, infrastructure, and technology-oriented sectors. Many of the companies covered in the Q1 period rely heavily on roles in engineering, technical operations, data infrastructure, and applied sciences, where female participation has historically been low. As a result, workforce composition is largely determined upstream (at the education and early-career level) rather than downstream at the company-level hiring policies.
This is reflected in consistently low female representation across these sectors, typically in the 10-30% range (example Maxam 14% SGB-SMIT 13%, Ramudden 17%), with similar constraints visible in companies operating in digital infrastructure, aerospace, and advanced manufacturing (example Applied Digital, Eutelsat, Aptiv). The impact extends into leadership, where limited inflows from technical roles create a constrained promotion pipeline, contributing to persistently lower representation at senior and executive levels.
This dynamic contrasts with non-STEM-intensive sectors, where talent pools are broader and less structurally imbalanced. Service-oriented and healthcare-related businesses show materially higher female participation (example Flora Food 39% workforce, HomeToGo 51%, IVC Evidensia 87%), indicating that workforce composition is more flexible where role requirements are less tied to technical specialization.
Geographic differences reinforce this pattern, though variation remains closely tied to sector composition. European issuers report higher average female workforce representation (36.7%) than U.S. peers (28.5%), reflecting the concentration of service-oriented sectors and broader labor participation in certain markets. At the extremes, workforce representation ranges from 87% in service-oriented EU analyzed issuers to below 15% in industrial and energy companies across both regions, suggesting that sector dynamics remain a stronger determinant than geography alone.
Governance Gaps by Ownership in Q1 Primary Dataset
Governance outcomes across our ESG Q1 primary dataset diverge clearly along ownership lines. Of the 73 primary issuers identified in Q1 2026, 71 are included in ownership-based comparisons, with two issuers excluded due to non-standard ownership structures. Within this analytical subset, sponsor-backed issuers, which account for 70.4% of issuers, consistently exhibit weaker board independence, lower diversity and more variable disclosure than publicly listed peers. These differences reflect the concentration of ownership and control within private market structures rather than isolated cases.
Board independence represents the most pronounced gap. Among the 27 issuers providing quantitative disclosure, sponsor-backed companies report an average board independence of 9.5%, compared with 78% for publicly listed issuers. A subset operates with no independent representation: 4 issuers (14.8% of disclosing issuers) report 0% independent directors, including Apleona, European Camping Group, Grupo UAX, Maxam, Prosol and Telenet. A further 7 issuers (25.9%) report less than 25% independence, indicating that limited external oversight remains a recurring feature among issuers. In contrast, companies such as HomeToGo SE report fully independent boards, highlighting the range of governance structures observed.
Board diversity follows a similar pattern. Among the 49 issuers disclosing board composition, sponsor-backed issuers report an average of 16.5% female representation compared with 32.4% among publicly listed companies. Ten issuers (20.4% of disclosing issuers) report no female representation at board level, including Element Materials Technology, Europe Snacks, Inspired Education, Maxam, Ramudden, SGB-SMIT, Telenet and VDK Groep. A further 19 issuers (38.8%) report female representation below 20%, highlighting persistent disparities. Higher representation is observed in selected issuers such as Tarkett, which reports 50% female representation at supervisory board level.
Disclosure reinforces this divergence. Of the 73 issuers analyzed, 41 (56.2%) provide full governance disclosure, 25 (34.2%) provide partial disclosure and 7 (9.6%) provide no governance disclosure. Among sponsor-backed issuers, 18% provide no governance disclosure. Several issuers provide limited or no governance disclosure, including Blackstone CQP, Consolidated Energy, European Camping Group, Fortifi, Pelican Pipeline and Peninsula Pacific Entertainment, limiting comparability across issuers.
This divergence extends to ESG oversight. All publicly listed issuers disclose board-level responsibility for ESG. Overall, 33 issuers (45.2%) report board-level oversight, 18 (24.7%) assign responsibility at management level and 22 (30.1%) provide no disclosure. Among sponsor-backed issuers, only 20% report board-level oversight, while 36% assign responsibility at management level and 44% provide no disclosure. Governance integration therefore remains uneven among sponsor-backed issuers in the Q1 sample.
Where disclosed, board composition reflects concentrated ownership. Ahlsell reports seven shareholder-appointed directors, while Maxam reports five sponsor representatives. Similar patterns are observed at Rubix and VDK Groep, while in many other cases sponsor involvement is indicated but not quantified.
Despite this, governance outcomes are not uniform. Some issuers demonstrate comparatively stronger frameworks under sponsor ownership. Tarkett reports balanced board representation and structured oversight, while Flora Food Group discloses a majority non-executive board and ESG-linked incentives. Europa University Education Group reports balanced board composition and formal governance policies.
Sector Composition, Ownership and Disclosure Trends
Within the ESG Octus-covered Q1 primary dataset, which represents only a selected subset of 73 issuers and not the full Q1 2026 new issuance universe, industrials dominate the issuer mix, representing 29.2% of the sample (21 issuers), followed by Consumer Discretionary at 22.2% and Health Care at 11.1%. This concentration reinforces the dataset’s tilt toward sectors with heavier operational, supply-chain and transition-risk exposure, while lower representation in Financials (2.8%), Information Technology (4.2%) and Real Estate (1.4%) limits sector balance.
Cyclical and industrial sectors account for the majority of activity, with Industrials, Consumer Discretionary, Materials and Energy together comprising 65.3% of issuers. This suggests ESG dispersion in the dataset is shaped primarily by sectors where decarbonization, safety and governance execution tend to be more material credit considerations.
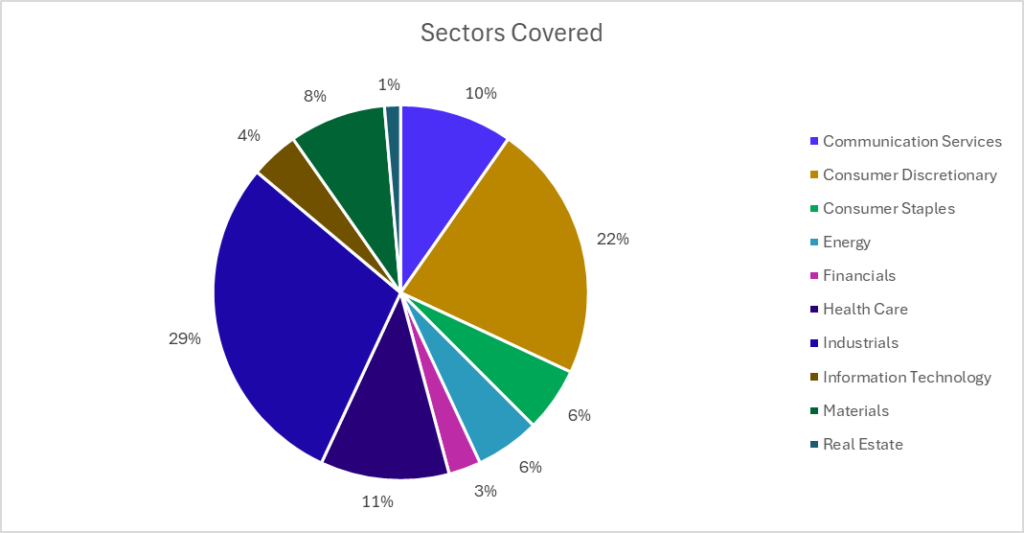
Source: Octus Data
The issuer base is predominantly privately owned (74%), with publicly listed companies accounting for 26%. This ownership mix indicates a strong concentration of sponsor-backed and non-listed issuers in the sample, shaping governance structures, disclosure practices and issuer-level ESG comparability.
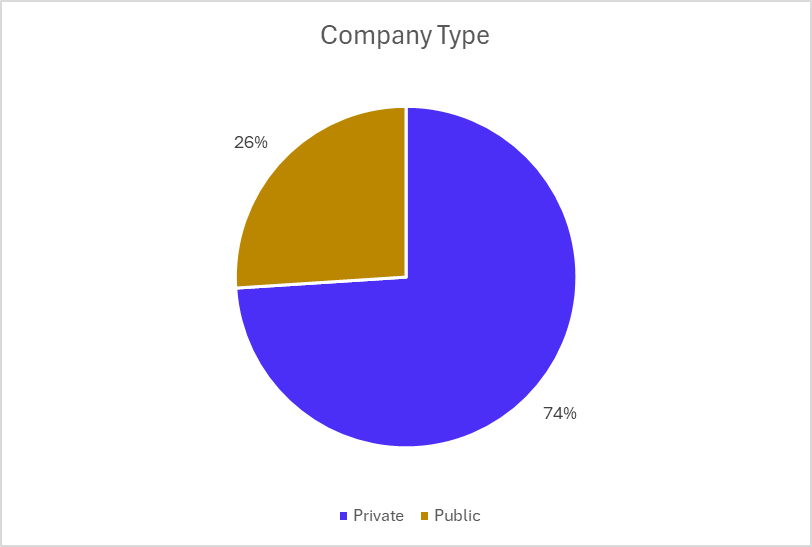
Source: Octus Data
Disclosure is relatively robust across the sample, with 93.2% of issuers not classified as limited disclosure, while only 6.8% fall into the limited disclosure category. This suggests transparency gaps are concentrated in a small subset of issuers rather than representing a broad market characteristic, with disclosure weaknesses appearing more issuer-specific than structural across the dataset.
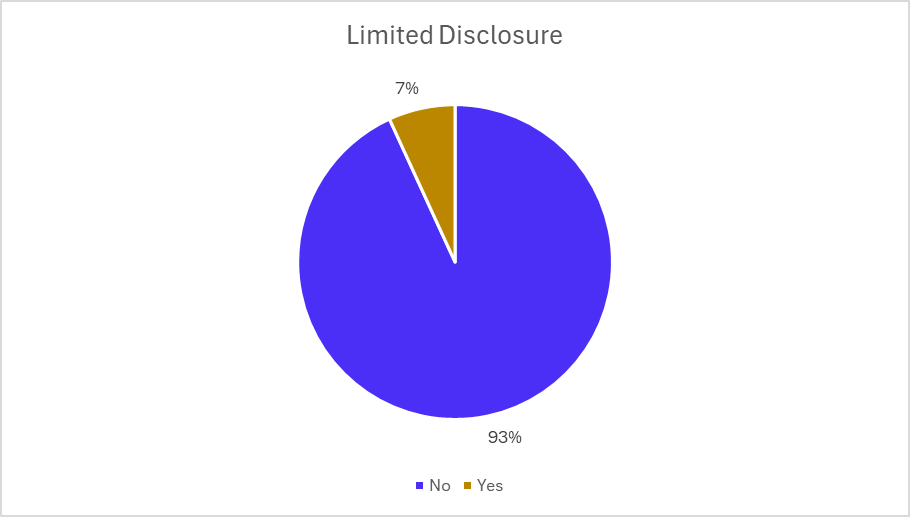
Source: Octus Data
Macroeconomic and Geopolitical Drivers of Q1 Primary Market Activity
Primary leveraged loan and high-yield bond issuance in Q1 2026 took place against a backdrop of elevated geopolitical tension, shifting trade policy and persistent inflationary pressure, creating an environment in which policy and market shocks reinforced volatility.
Trade policy remained a key source of uncertainty. In February, a U.S. Supreme Court ruling invalidated tariff measures introduced under emergency powers, prompting a revised global tariff framework under alternative legal authority. Further adjustments in March, including proposals to increase tariff levels, extended uncertainty around the scope and durability of trade measures.
Geopolitical tensions intensified toward quarter-end following escalation between the United States and Iran in late February 2026. Military actions disrupted shipping through the Strait of Hormuz, a key corridor for global oil flows, affecting oil and liquefied natural gas supply and driving sharp energy price movements.
These developments fed into broader macroeconomic conditions, with energy volatility adding to inflationary pressure while growth expectations remained subdued, particularly in Europe. Central banks, including the Federal Reserve, European Central Bank and Bank of England, held rates steady amid heightened uncertainty.
Financial markets reflected these dynamics, with February and March marked by elevated volatility and sensitivity to policy and geopolitical developments. Equity performance was mixed, while demand for fixed income strengthened, indicating a shift toward more defensive positioning. Pressure also emerged in parts of the private credit market, including asset sales and tighter liquidity.
Regional divergence remained evident, with the United States entering 2026 with stronger momentum, supported by resilient consumption and corporate performance, while Europe faced a more constrained outlook due to higher exposure to energy volatility, trade pressures and weaker growth.
Taken together, Q1 2026 was defined by geopolitical disruption, trade policy uncertainty, renewed inflationary pressure and tighter financial conditions, shaping the backdrop for primary market activity.
Stay up to date on ESG trends and data with Octus® Sustainability 360.
This publication has been prepared by Octus Intelligence, Inc. or one of its affiliates (collectively, "Octus") and is being provided to the recipient in connection with a subscription to one or more Octus products. Recipient’s use of the Octus platform is subject to Octus Terms of Use or the user agreement pursuant to which the recipient has access to the platform (the “Applicable Terms”). The recipient of this publication may not redistribute or republish any portion of the information contained herein other than with Octus express written consent or in accordance with the Applicable Terms. The information in this publication is for general informational purposes only and should not be construed as legal, investment, accounting or other professional advice on any subject matter or as a substitute for such advice. The recipient of this publication must comply with all applicable laws, including laws regarding the purchase and sale of securities. Octus obtains information from a wide variety of sources, which it believes to be reliable, but Octus does not make any representation, warranty, or certification as to the materiality or public availability of the information in this publication or that such information is accurate, complete, comprehensive or fit for a particular purpose. Recipients must make their own decisions about investment strategies or securities mentioned in this publication. Octus and its officers, directors, partners and employees expressly disclaim all liability relating to or arising from actions taken or not taken based on any or all of the information contained in this publication. © 2026 Octus. All rights reserved. Octus(TM) and the Octus logo are trademarks of Octus Intelligence, Inc.